
Source: SSA, https://www.ssa.gov/policy/docs/chartbooks/fast_facts/2024/fast_facts24.pdf Note: Totals do not necessarily equal the sum of rounded components
Although Social Security provides important financial protection for people in their working years by way of disability or survivors, over four-fifths of the people receiving Social Security, 87%, are age 62 or older.
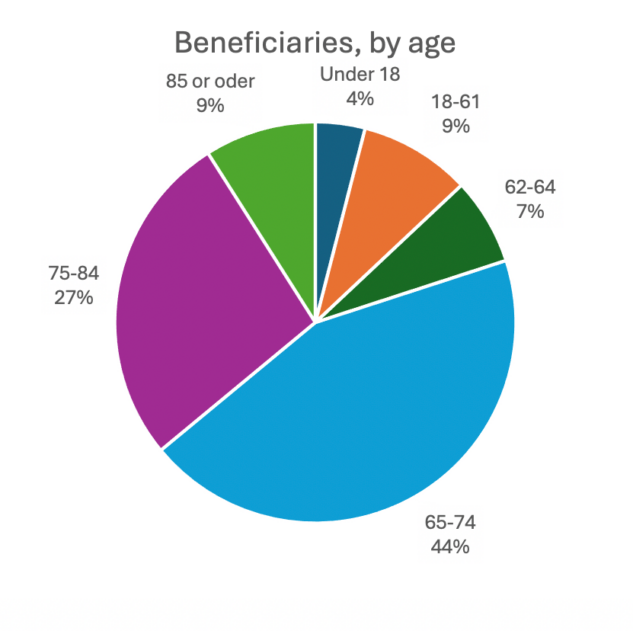
The following chart illustrates the age stratification for all Social Security beneficiaries, with an additional breakout for those age 62 and older.
| Group/% of Total | Number | Male/% of Group | Female/% of Group |
| All beneficiaries/100% | 67,076,966 | 30,469,323/45% | 36,607,643/55% |
| Age-Under 18/4% | 2,547,804 | 1,298,709/51% | 1,249,095/49% |
| Age 18-61/9% | 5,578,162 | 2,719,614/49% | 2,858,548/51% |
| Age 62 and over/87% | 58,951,000 | 26,451,000/45% | 32,500,000/55% |
Older Adult Age Cohorts, end of June 2024
| Group/% of Total | Number | Male/% of Group | Female/% of Group |
| Age 62-69/33% | 19,262,000 | 8,812,000/45.7% | 10,451,000/54.3% |
| Age 70-84/57% | 33,686,000 | 15,385,000/45.7% | 18,301,000/54.3% |
| Age 85 and older/10% | 6,003,000 | 2,254,000/37.5% | 3,749,000/62.5% |
| TOTAL Age 62 and older | 58,951,000 | 26,451,000/44.9% | 32,500,000/55.1% |
At each age bracket, women are the majority of beneficiaries. At the most advanced brackets, age 85 and older, women hold a supermajority at 62.5%. This is critical from a policy and legislative perspective because the importance of Social Security benefits increases incrementally each year as you age. This gradual increase in importance of Social Security as a dependable, inflation-protected income flows from the health expense increase and steady depletion of assets that accompany advancing age.
Sources:
https://www.ssa.gov/policy/docs/chartbooks/fast_facts/2024/fast_facts24.pdf
https://www.ssa.gov/oact/progdata/byage.html
https://www.ssa.gov/oact/progdata/byage.html?type=ra
https://www.ssa.gov/policy/docs/statcomps/supplement/2024/5a.pdf
Government Relations and Policy, October 2024