 Did you know May is Older American and Asian-Pacific American month? Ok, we know you’re not likely to be hosting a big party in celebration and your local bars haven’t set out extra tables for the expected crowds; however, what is important about these designations is the opportunity it provides to talk about American communities which might be overlooked in our national debate otherwise.
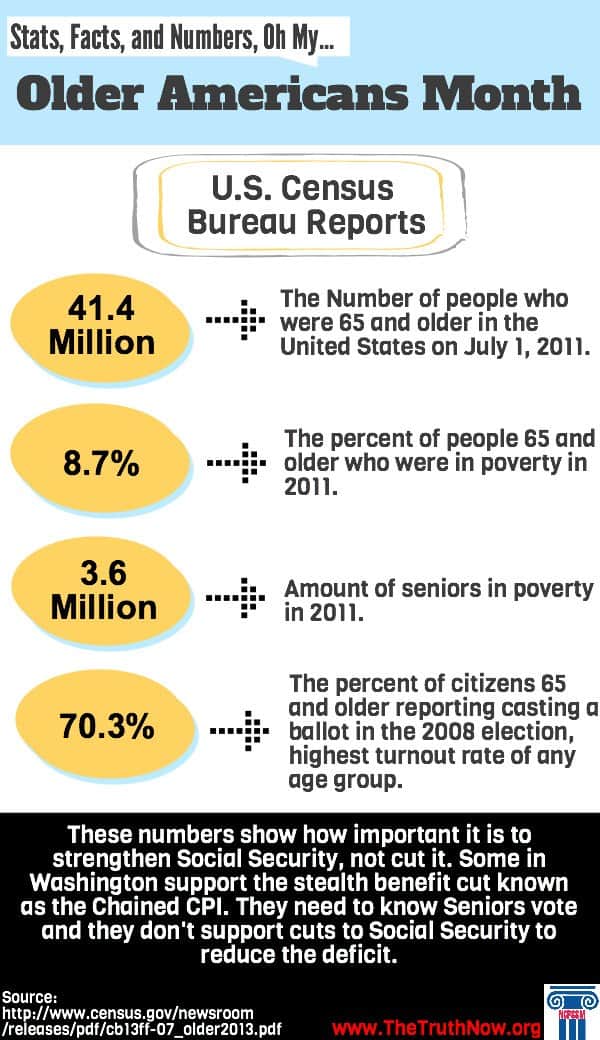
In the case of older Americans, the U.S. Census Bureau has provided a terrific breakdown of its most recent survey’s statistics on what our nation’s senior community looks like. Here are some interesting stats:
41.4 million – The number of people who were 65 and older in the United States on July 1, 2011, up from 40.3 million on April 1, 2010 (Census Day). In 2011, this group accounted for 13.3 percent of the total population.
92.0 million – Projected population of people 65 and older in 2060. People in this age group would comprise just over one in five U.S. residents at that time. Of this number, 18.2 million would be 85 or older.
Nearly 17% – Projected percentage of the global population that would be 65 and older in 2050, up from 8 percent today. In 2005, Europe became the first major world region where the population 65 and older outnumbered those younger than 15. By 2050, it would be joined by Northern America (which includes Canada and the United States), Asia, Latin America and the Caribbean and Oceania (which includes Australia and New Zealand).
$33,118 – The 2011 median income of households with householders 65 and older, not significantly different from the previous year.
8.7% – The percent of people 65 and older who were in poverty in 2011, statistically unchanged from 2010. There were 3.6 million seniors in poverty in 2011.
16.1% – The percentage of people 65 and older who were in the labor force in 2010, up from 12.1 percent in 1990. These older workers numbered 6.5 million in 2010, up from 3.8 million in 1990. By 2011, this rate had increased to 16.2 percent.
70.3% – Percentage of citizens 65 and older reporting casting a ballot in the 2008 presidential election. Not statistically different from those 45 to 64 (69.2 percent), people 65 and older had the highest turnout rate of any age group.
53,364 – The number of people 100 years old and older counted by the 2010 Census.